


It is common knowledge that boarding an airplane can be cumbersome. From booking tickets to checking in, handing over luggage, going through security inspection, finding the boarding gate, and other processes you go through to transport yourself from one location to another. It is only fair that Aircrew makes these processes easier for their passengers and gives them a good customer experience.
THE TASK
The task is to recommend a data-driven strategy for increasing Maven Airlines' satisfaction rate.
I assumed the role of Senior Data Analyst for Maven Airlines, a US-based airline headquartered in Boston, Massachusetts. The satisfaction rate dipped under 50% for the first time, so the leadership team needs me to analyze the data and find the key areas to focus on to get back on track. I will be explaining my analysis and visualizations in this post.
ANALYSIS TOOL
I carried out data cleaning, analysis, visualization, and dashboard creation using Microsoft Excel.
ABOUT THE DATASET
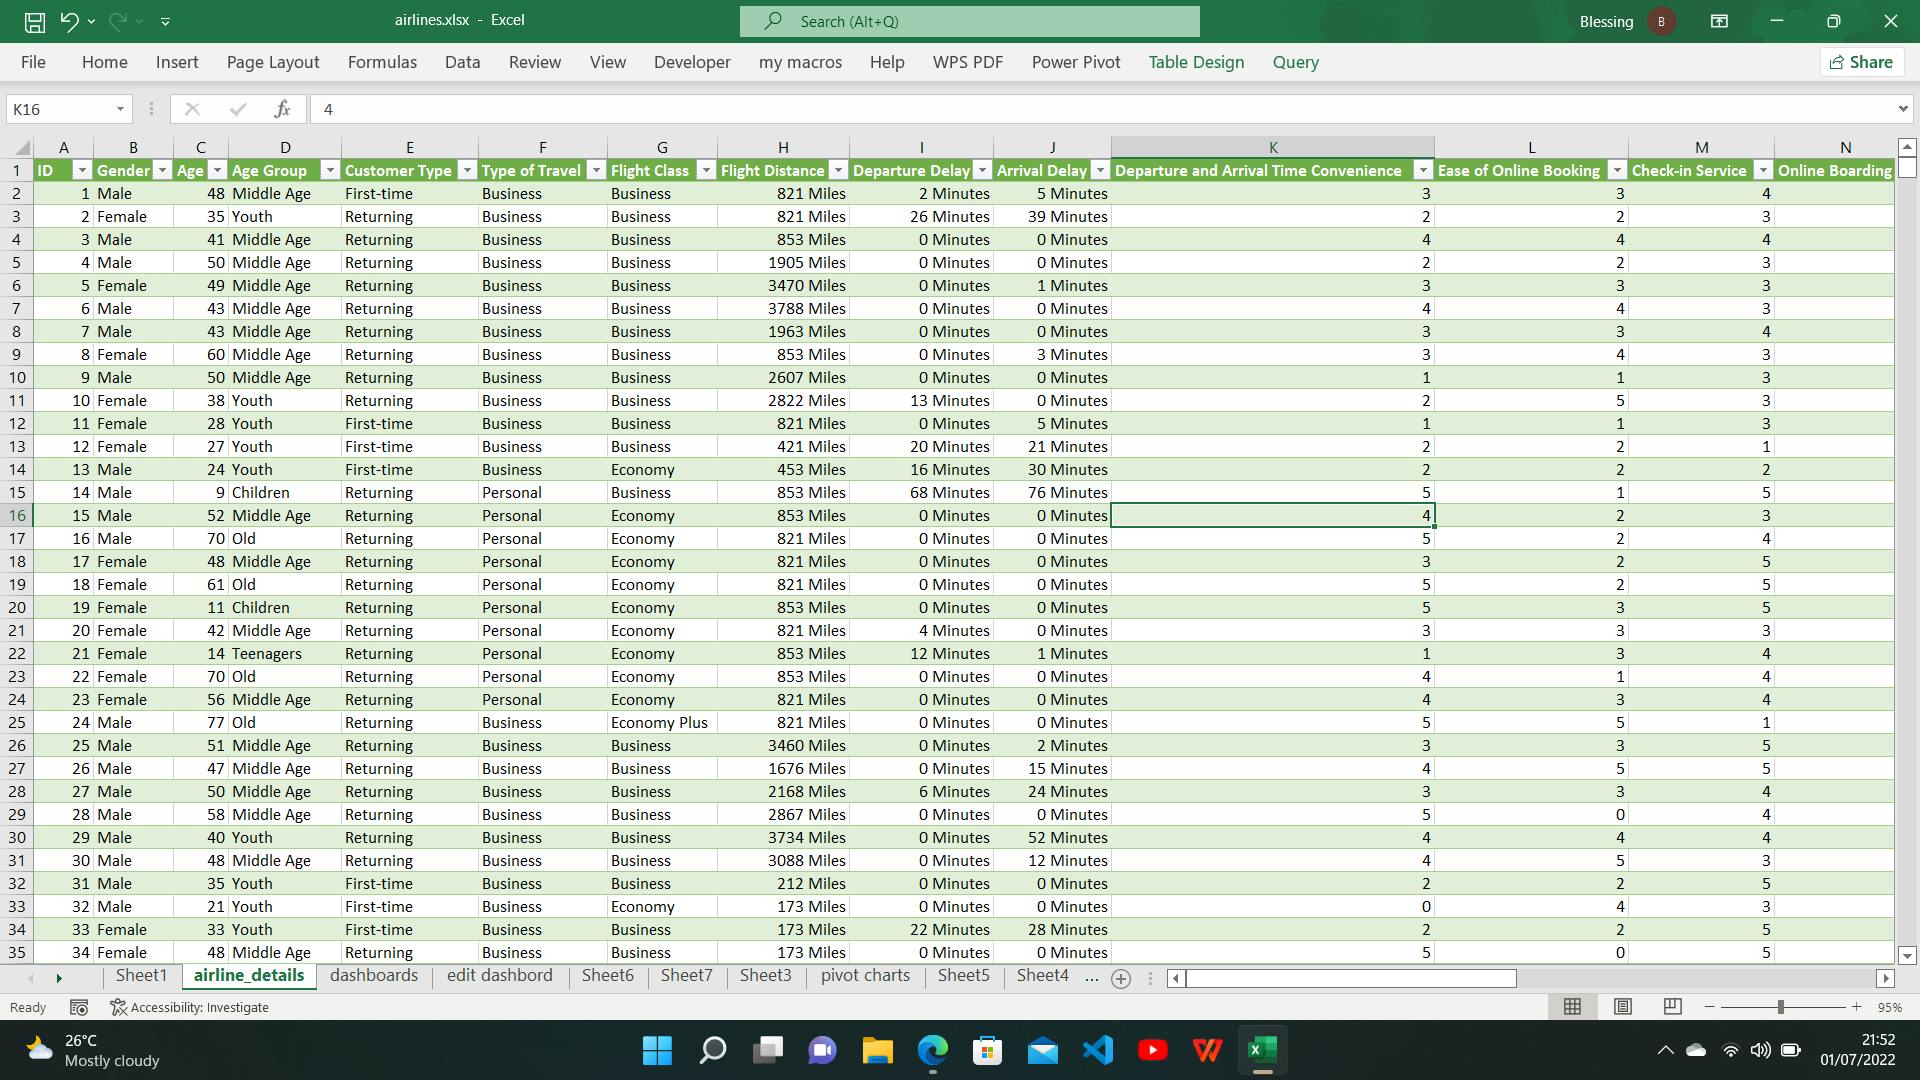
The dataset contains satisfaction scores for the 129,880 passengers surveyed. Other information gathered include their ages, gender, class of travel, the purpose of travel, distance traveled, and flight delays.
Each customer gave a satisfaction score from 0-5 (where, 0 means "not applicable", 1 is the lowest score and 5 is the highest score) for every service rendered by the airline during their travel and their overall satisfaction level with the airline (satisfied/dissatisfied or neutral).
TARGET QUESTIONS
- What percentage of the passengers were dissatisfied?
- What flight class were most dissatisfied?
- What services had the most dissatisfaction?
- What can we do to increase our satisfaction score?
DATA CLEANING
The data was not too messy. While cleaning;
I made sure each column had the correct data type.
I checked for duplicate entries, of which I found none.
I checked for empty cells, of which I found 393 blank cells under the "Arrival Delay" column.
I replaced the empty cells with zeros.
I binned the age into age groups with an interval of 10.
I added the correct time and distance units to the columns required.
ANALYSIS
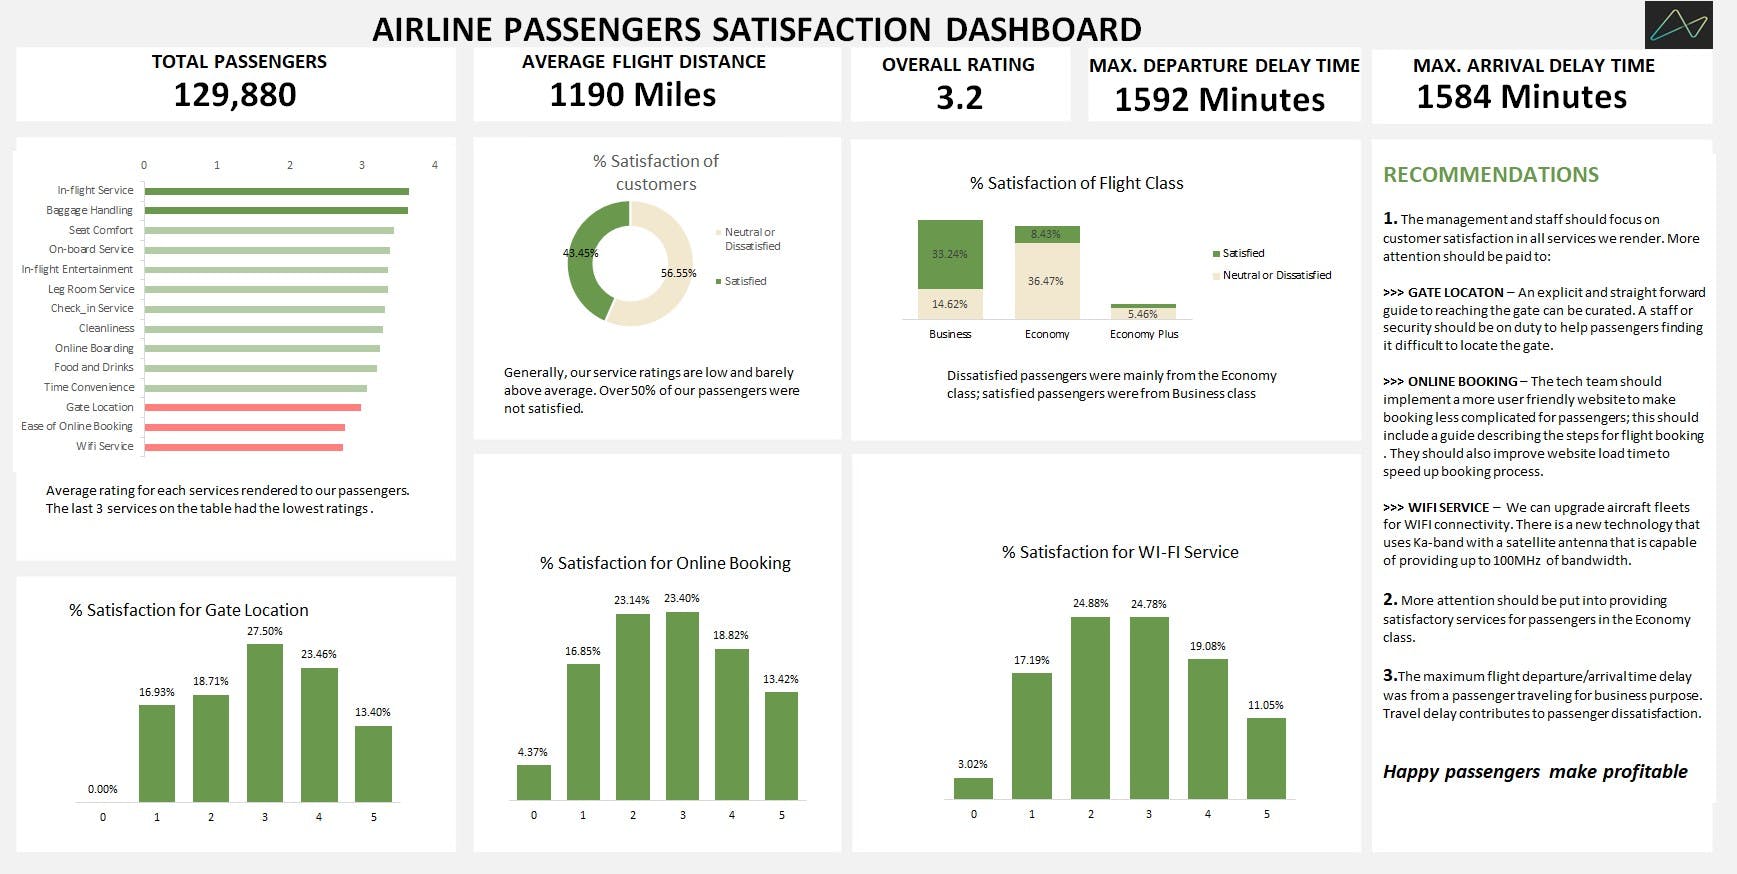
- I used the "AVERAGE" function to calculate the overall average rating for the airline.

- The average flight distance traveled by passengers is 1190.3Miles.
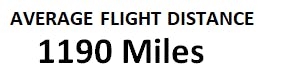
- The longest departure and arrival time delays experienced by passengers were calculated using the "MAX" function.
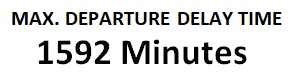

- Generally, the service ratings were low. 43.45% of the passengers were satisfied while 56.55% were dissatisfied or neutral with the airline.
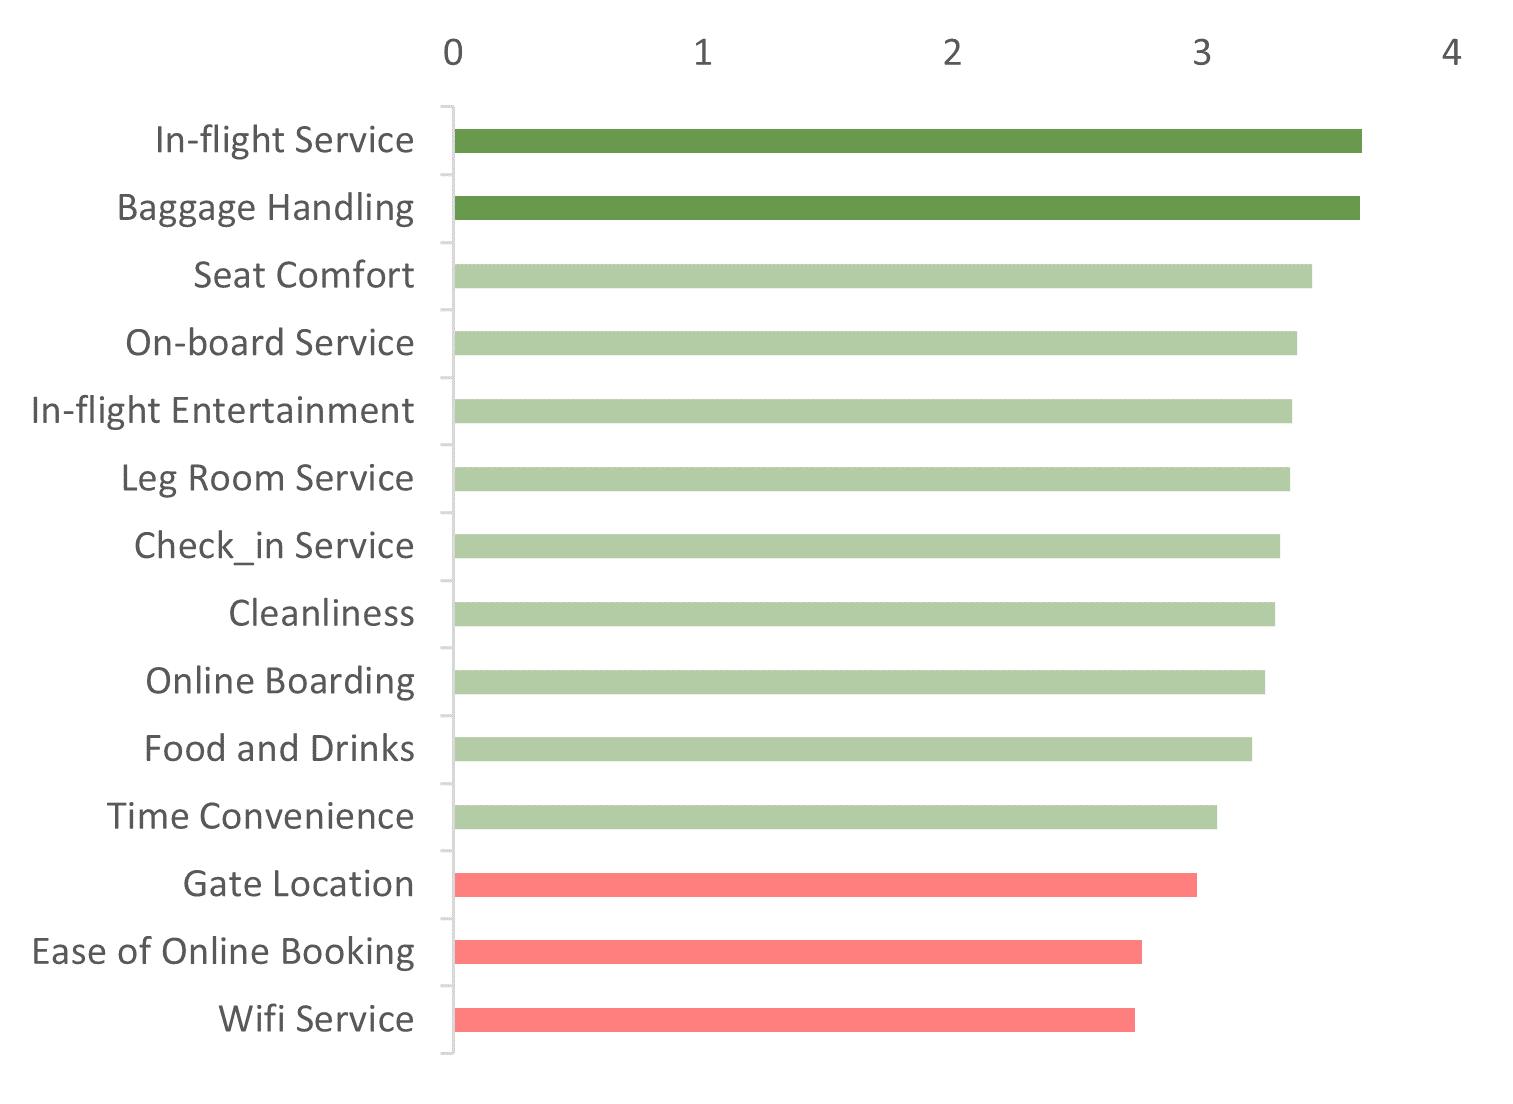
- The average rating for each service rendered is displayed in descending order. The in-flight services and baggage handling had the highest ratings of 3.64 and 3.63 respectively. On the other hand; the gate location, online booking, and Wi-Fi services had lower ratings of 2.98, 2.76, and 2.73 respectively.
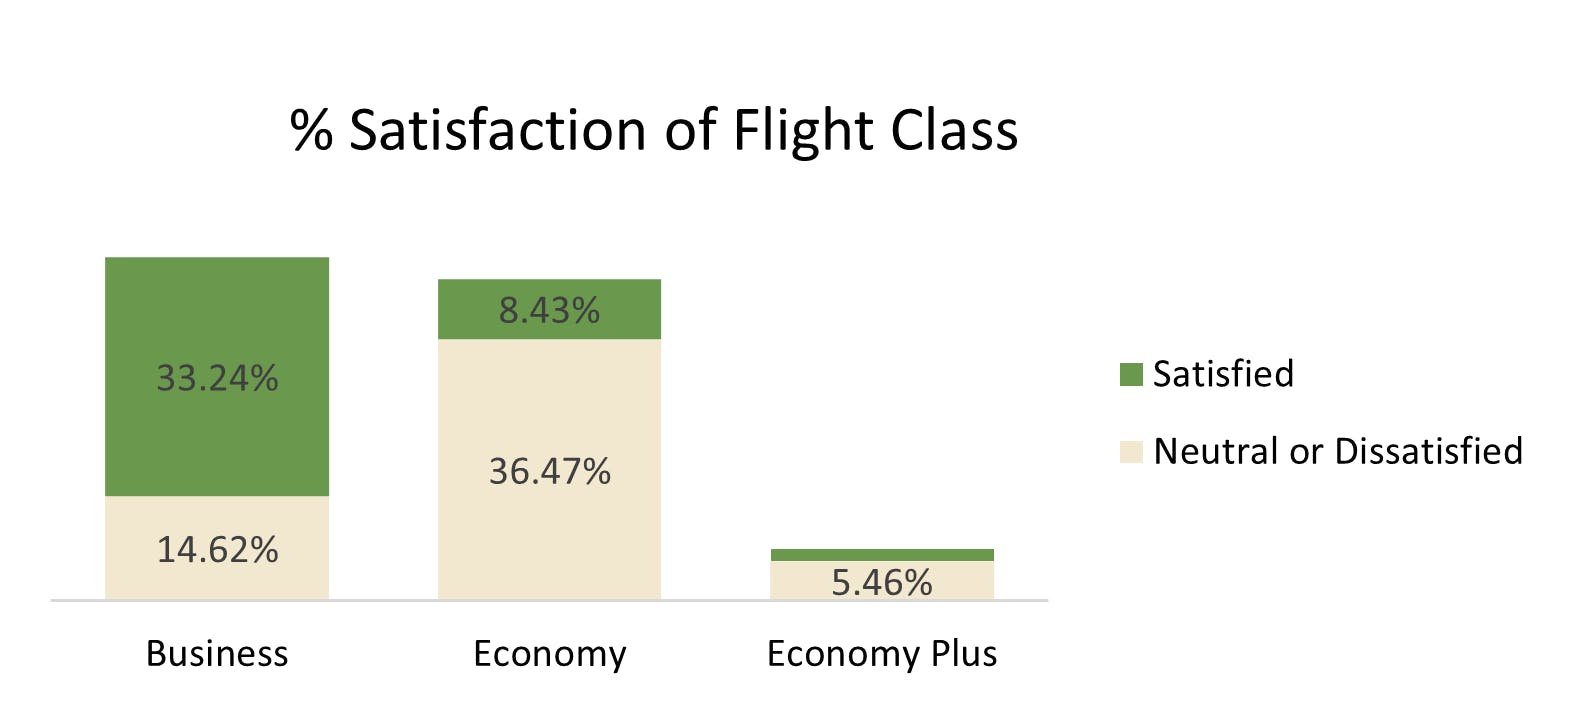
- 33.24% of the 43.45% satisfied passengers were those that boarded business class. This shows that more attention and priority were given to the business flight class.
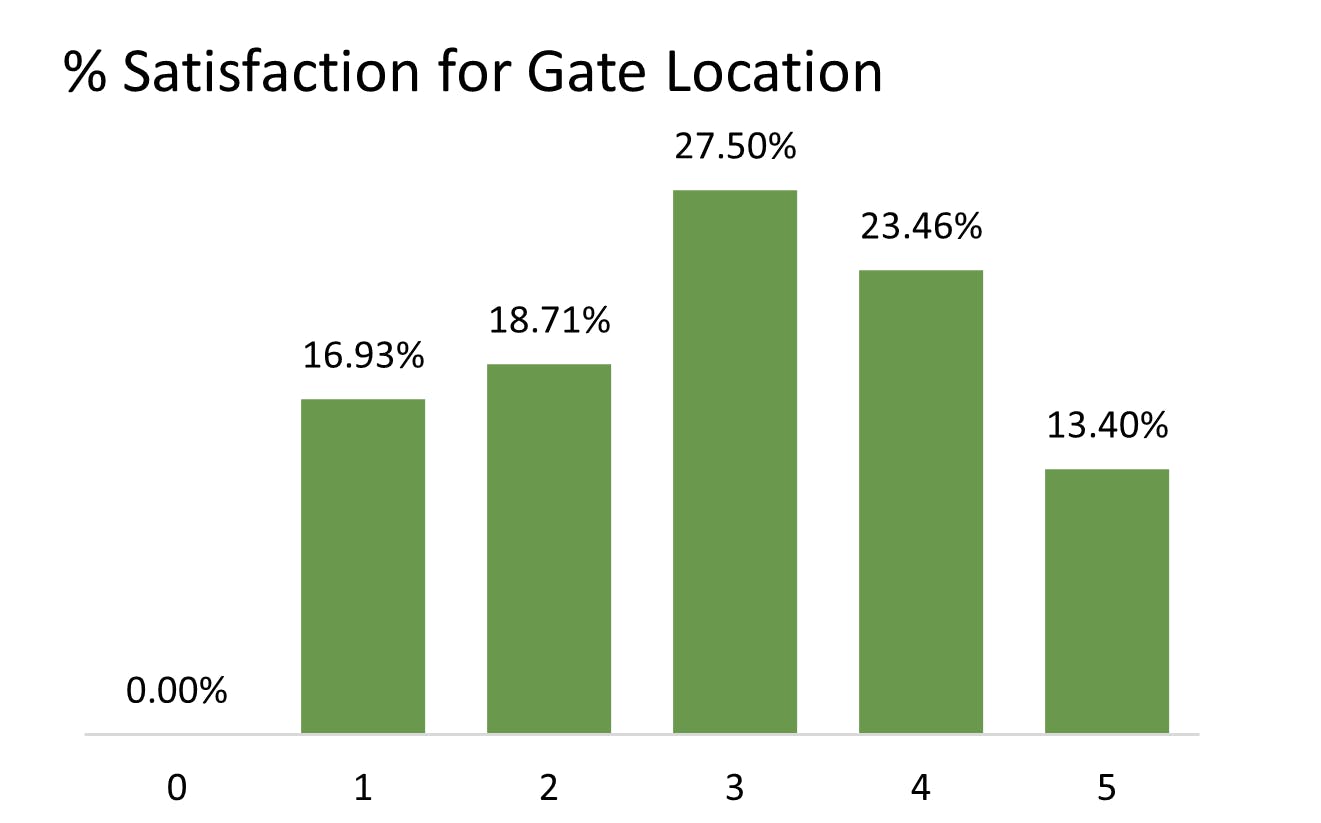
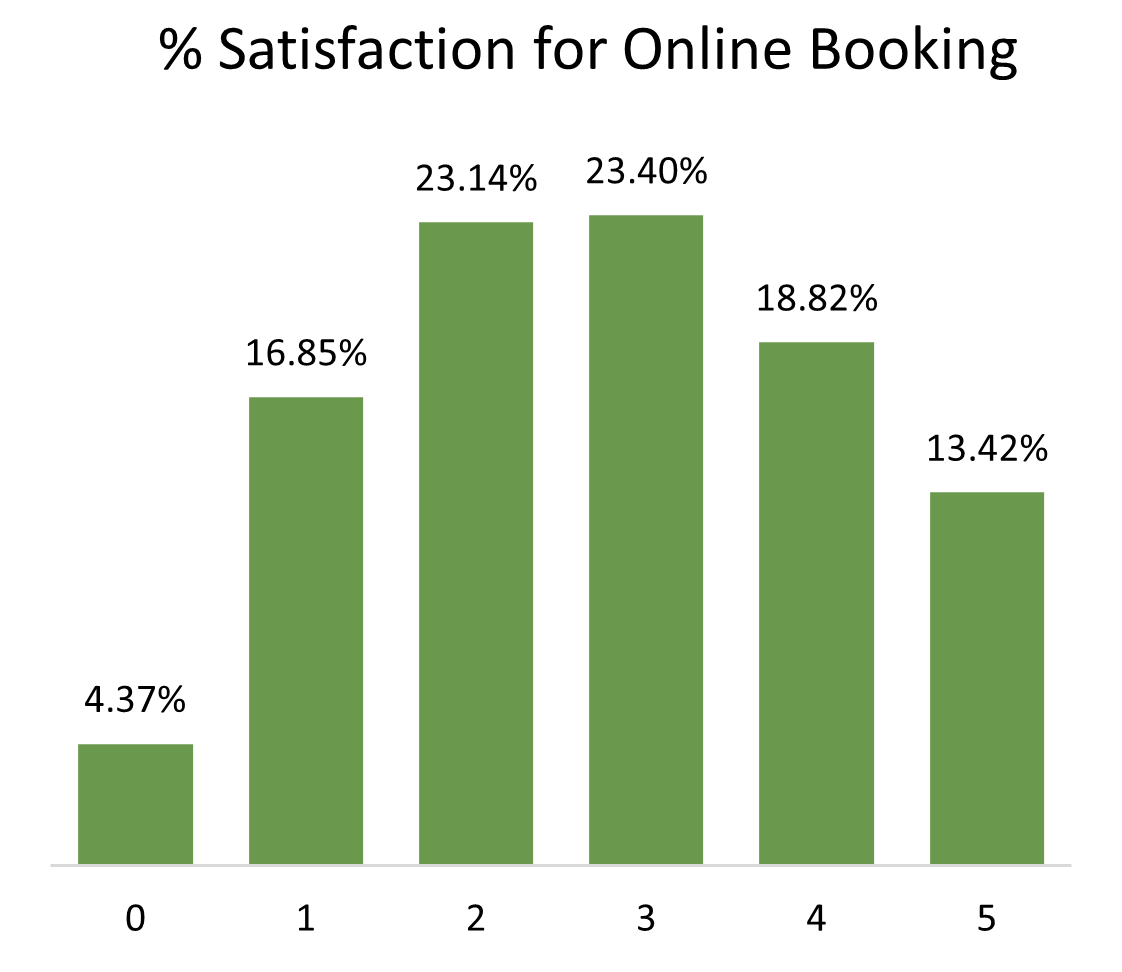
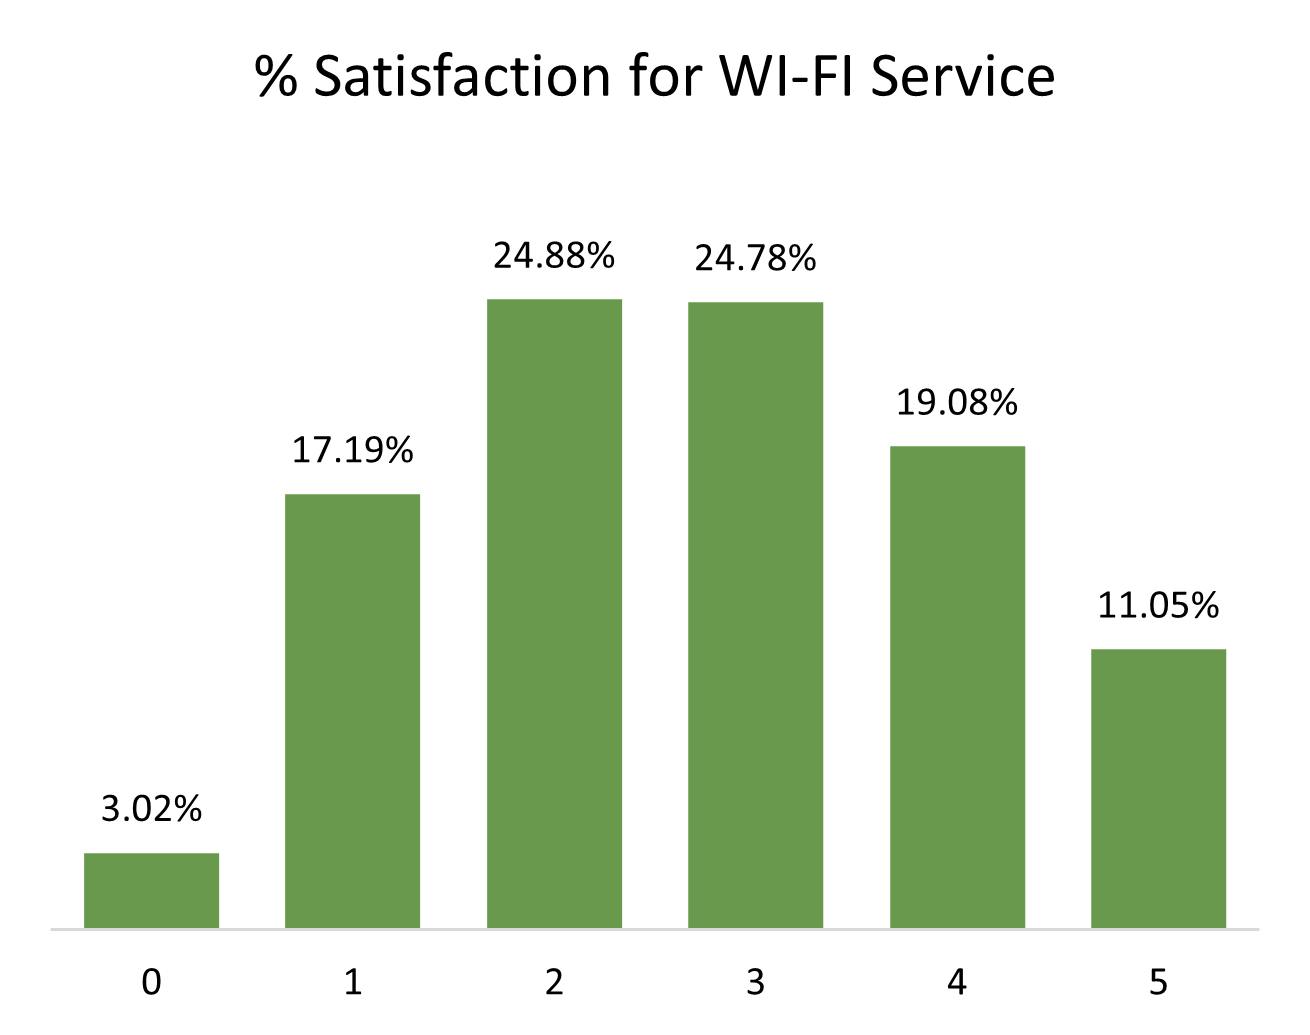
- The percentage of each satisfaction score for the least satisfactory services-
GATE LOCATION
ONLINE BOOKING
WI-FI SERVICES
A combination of all the relevant visuals for this study is seen on the dashboard below:
RECOMMENDATIONS
- The management and staff should focus on customer satisfaction in all services rendered. Attention should be paid to:
GATE LOCATION: A straightforward guide to reaching the gate can be curated. In addition to this, a staff member should be on duty to help passengers that find it difficult to locate the gate.
ONLINE BOOKING: The tech team should implement a more user-friendly website to make the online-booking less complicated for passengers; this should include a guide describing the steps for flight booking. They should also improve website load time to speed up the booking process.
WI-FI SERVICE: An upgrade of the aircraft fleets for WIFI connectivity would increase satisfaction. There is a new technology that uses a Ka-band with a satellite antenna capable of providing up to 100MHz of bandwidth.
2.The airline should improve services rendered to passengers in the Economy and
Economy Plus class.
3.The maximum flight departure/arrival time delay was from a passenger traveling for business purposes. Travel delay contributes to passenger dissatisfaction.
Happy passengers make profitable airlines!